Source: PaxForex Premium Analytics Portal, Technical Insight
The U.S. stock market closed Thursday's trading after the Dow Jones and S&P 500 indicators showed the biggest daily drop since late October. Investors focused on corporate reports and statistical data. The Dow Jones Industrial Average index rose 300.19 points (0.99%) to 30,603.36 points.
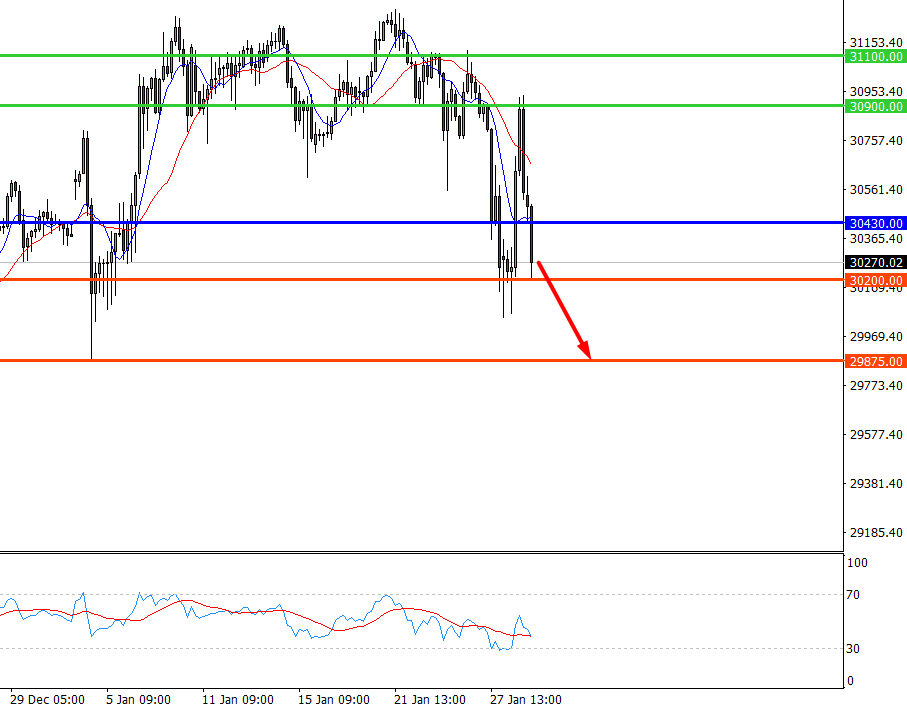
Dow Jones 30, H4

Pivot: 30300.00
Analysis:
Provided that the index is traded below 30430.00, follow the recommendations below:
- Time frame: H4
- Recommendation: short position
- Entry point: 30300.00
- Take Profit 1: 30200.00
- Take Profit 2: 29875.00
Alternative scenario:
In case of breakout of the level 30430.00, follow the recommendations below:
- Time frame: H4
- Recommendation: long position
- Entry point: 30430.00
- Take Profit 1: 30900.00
- Take Profit 2: 31100.00
Comment:
RSI indicates a downtrend during the day.
Key levels:
| Resistance | Support |
| 31100.00 | 30200.00 |
| 30900.00 | 29875.00 |
| 30430.00 | 29820.00 |
Dow Jones 30, D1

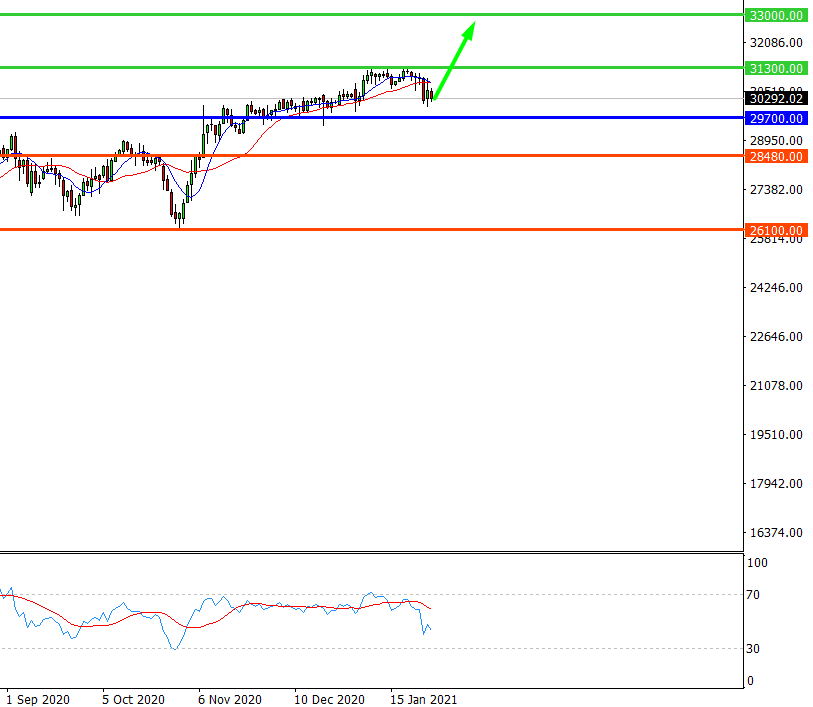
Pivot: 30303.00
Analysis:
While the price is above 29700.00, follow the recommendations below:
- Time frame: D1
- Recommendation: long position
- Entry point: 30303.00
- Take Profit 1: 31300.00
- Take Profit 2: 33000.00
Alternative scenario:
If the level 29700.00 is broken-down, follow the recommendations below.
- Time frame: D1
- Recommendation: short position
- Entry point: 29700.00
- Take Profit 1: 28480.00
- Take Profit 2: 26100.00
Comment:
RSI is bullish and indicates a mid-term uptrend.
Key levels:
| Resistance | Support |
| 33450.00 | 29700.00 |
| 33000.00 | 28480.00 |
| 31300.00 | 26100.00 |


