


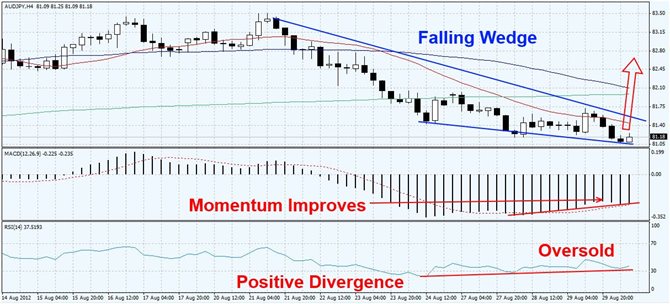
The AUDJPY has corrected for several sessions and formed a falling wedge formation as visible on this H4 chart. The price action currently evolves near the falling support level of the falling wedge formation and the two most recent candlestick patterns hint at a potential short-term bottom from which this pair is able to rally and retest its highs.
MACD has remained bearish, but momentum has started to improve during the last part of the correction which is another positive sign. RSI has formed a positive divergence, but remains in oversold territory. Furthermore it has crossed from extreme oversold territory into oversold which is another bullish indicator for this pair.
I recommend taking an initial long position at the 81.20 level and look for potential additions at the 79.50 level. Place your take profit level above the 82.40 mark or ride it to the top around 83.30.