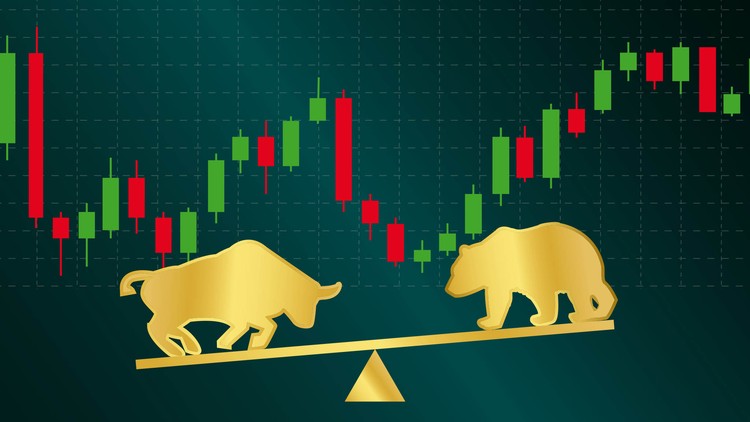

In the global foreign exchange market, retailers, investors, speculators, and institutions determine the relative value for the conversion of one currency to another via the buying a selling of currency pairs. There are a number of methods used by forex traders to predict the movements of currency pairs. Some traders focus on news, interest rates, and economic variables while others prefer to use charting tools and indicators to guide their trading decisions. However, no matter your trading method, you will need to know how to read a forex chart.
Charts evolved as an instrument of financial technical analysts, but they have found broader use over time among investors due to their quick and efficient communication of valuable information about market trends. With many options for traders to figure out how to follow trends on forex currency pairs as well as commodities and other instruments, the most trusted form would be to follow the charts. Traders that use chats are labeled as technical traders, who prefer to follow the accuracy of charting tools and indicators to identify peaking trends and price points as to when to enter and exit the markets.
Currency charts help traders evaluate market behavior, and help them determine where the currency will be in the future. To help make sense of the currency movements depicted on a chart, traders have developed a number of different visual guides to assist them – indicators. There are hundreds of different types of trading indicators developed to cover every aspect of forex trading, from trend following to mean reversion. The ability to read charts is part and parcel of trading, as it allows you not only to keep track of your current trades but helps to detect a developing trend line for your future trades.
As you grow more comfortable reading and examining the charts you will learn how to add other tools such as a technical analysis to measure the rate of market volatility and changes in value. These technical indicators can assist you in clarifying the exact market information that could be missed with some stocks or currencies that are commonly labeled as ‘oversold’ or ‘overbought’. In essence, technical indicators incorporated into your live charts like volume indicators, trend lines, Fibonacci levels, stochastic oscillators etc., can block out the market noise, forming a better picture of the markets and trends that lie ahead.
While no technical system is perfect and will win all the time, if your system is based on sound principles, you can keep losses small and make bigger profits to cover them and make profits long term. Charting your way to profits in the currency markets is similar to, the way the captain of a ship uses charts on the ocean. You know the ocean is all powerful just as the forex markets are. Charts can help him navigate the ocean safely the successful chartist knows his charts can help him navigate the currency markets and make overall profits on his trading signals.
To receive new articles instantly Subscribe to updates.