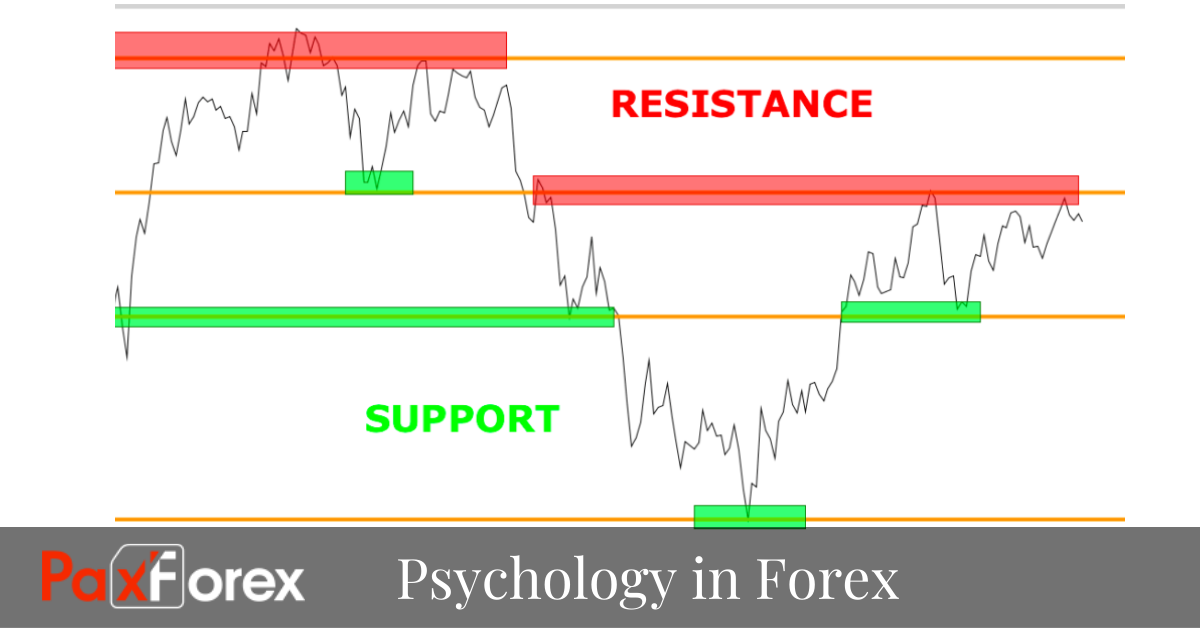
One of the most crucial skills in forex trading is the process of finding support and resistance levels. This is so because knowing the basics of support and resistance would improve upon any trading method. Support and resistance are specific levels or zones on the trading chart, where the price of a forex pair is likely to find opposition. The reason for this is that these are psychological levels showing the different attitudes of the market players.
The reason that support and resistance work and that the price will keep on touching and rebounding off them is down to the psychology of the market participants. There is no magic, just commonsense. One explanation of why it works so well involves thinking of the psychology of the traders in the market. Now there are many reasons that traders will buy or sell, but they are usually driven by the profit motive – either to position themselves to make more money, or to try to ease the pain of losing money for a trade that they have already taken out.
It is a common thought that there is only one kind of support and resistance, and it occurs from only one thing: the price. While support and resistance lines are important due to price, some prices are more important than others. These support and resistance lines are what are known as psychological support and resistance levels. Psychological support and resistance lines occur not because of the perceived importance of a particular price to a currency pair, stock, bond or security, but due to the fact that it is a “psychologically” important number.
Psychological levels are price levels which tend to draw big market attention and typically witness a reaction by price when tested. Fear, greed and herd instinct are terms that often come up when discussing the financial markets. This is because human emotions and behavior are largely responsible for price movements in the markets. A price chart, then, can be thought of as a graphical representation of emotions such as fear, greed, optimism and pessimism, and human behavior, such as herd instinct. Price charts illustrate how market participants react to future expectations.
Traders value simplicity and therefore tend to push prices towards areas where prices are rounded. This creates areas of resistance and areas of support at which prices tend to stall. Prices will continue to stall at these prices unless there is a breakout and the market sentiment changes. In such an event, a previous support level would become a resistance level and a previous resistance level would become a support level. These levels of support and resistance can help traders to more accurately predict the movement of prices. This means that resistance and support can actually help traders to earn more profits and to make better trading decisions.


