Did you know that the strength of a currency pair can be measured? Did you know that the obtained parameter can significantly increase the percentage of profitable trades? Many believe that the main task of a trader and the key to his successful trading is his ability to predict the market trend. As we know, the direction of the currency market is determined by the struggle of currencies. The market is moving towards a stronger currency instrument. A trader can measure the strength of currencies by using a simple Currency Strength Meter.
This very indicator is designed in such a way that it shows the weak and strong currencies at any outlined period of time, displaying that with the help of a matrix. Implementing a currency strength meter in your trading analysis gives you one more handy gear that will increase your odds of becoming a flourishing trader.
So, today we will provide valuable insight into the nature of the currency strength, including the correlation of the different currencies. Also, you will learn how to use the correlation matrix in order to improve your trading results, as well as how to benefit from the currency strength meter. Get some coffee and let's get started.
What is a Currency Strength Meter?
Before we move to the correlation between assets and the implementation of the indicator itself, let us find out what is a currency strength meter. Then we will be able to proceed.
Basically, a currency strength meter is a demonstrative model that shows which of the currencies are currently strong, and which ones are weak. This indicator makes use of the exchange rates of various Forex assets to generate composite, comparative strength of each currency.
The calculation is performed on all pairs in which the currency is involved.
For instance, to measure the strength of the USD, the currency strength meter will calculate the strength of all the assets including the USD (USD/CHF, NZD/USD, GBP/USD, AUD/JPY...) and then add these results together to give an aggregate score for the U.S. dollar.
Much less popular, but a more thorough meter is the comprehensive USD index. It can be more useful for some traders since it applies a more large-scale variety of Forex assets. Both of them operate in the same way.
Therefore, the trader only needs to select the strongest and weakest currency in a certain period of time and assume its further movement, using additional filters. These filters can be usual stochastics, or the use of important levels, or Fibonacci retracement.
However, it is important to analyze each specific situation individually, because often when we start to identify the strongest and weakest pair, their rise and fall are already over, and there may be a pullback in both. Therefore, it is recommended to check the additional signals, and not to neglect the classical technical analysis, as well as read the recommendations for these currencies shortly.
Issues with Currency Strength Meters
As a trader, you probably faced a situation when something was not working on the trading terminal due to some reasons, especially when trying to drag indicators to the chart. Unluckily, it happens all the time with numerous custom indicators, just because they are written not in the best way. In case there is the same situation with the currency strength meter, and if it provides wrong values, it will not be something you need in successful trading. Using currency strength meters that were created a long time ago, you may have the following issues: trading platform or computer freezes, glitches, memory downtime messages, CPU at 100%.
Some indicators downloaded from the Internet can sometimes be based on the concepts that have nothing to do with the currency strength meter. Others may include some smoothing indicators, like MA. While attaching filters on top of illustrating currency strength meter, you may be getting false trading signals. As a result, you will open positions you should not open and will encounter some monetary losses.
Alternatively, most traders agree that correlation has proved to be the best method for measuring currency strength. We must point out that correctly coded correlation matrix (and just like any other program), the one that is up to date, will not induce any technical problems, and will do its job for you to benefit from a currency strength meter.
Forex Correlation Matrix – The Real Currency Strength Meter
Forex correlation measures the relationship between any two assets over a specified period.
There are such notions as positive and negative correlations. A positive correlation between two currency pairs occurs when one currency pair repeats the movement of the other. And the more similar the price movements of these two pairs are, the greater the correlation value between them. In contrast, a negative correlation occurs when price changes for two currency pairs have the opposite direction. And the closer, conversely, one price moves in the opposite direction to the other, the stronger is the negative correlation.
The maximum positive correlation is 1 or 100%, the maximum negative correlation is -1 or -100%. The minimum value of the positive and negative correlation (or rather its complete absence) is described by zero. So, the closer the correlation value is to 1 or -1, the greater is the correlation between the currency pairs under consideration (the closer to 1 is the straight line, and to -1 is the inverse correlation), and the closer to 0, the less is the correlation.
There are 3 undeniable advantages to using a Forex correlation in your trading strategy:
The correlation will help you determine the strength of the current dominant trend in the market and whether it is likely to continue in this direction.
Forex correlations will show you how interconnected the currencies you have chosen to trade are and will also help you get the most out of this connection.
A strong correlation in Forex and the stock market will help you not only to understand the strength and stability of currency trends but also to apply this information in stock trading.
Understanding how different currency pairs are related to each other and why some pairs move in tandem, while others are significantly different, allows a deeper understanding of the Forex market exposure. The use of currency pair correlation can also give traders a deeper understanding of existing portfolio management techniques such as diversification, hedging, risk reduction, and increasing the profitability of their trades.
How can you use currency correlation to calculate currency strength?
Usually, traders can use correlation to confirm the correctness of the performed analysis. You can observe the behavior of a particular currency pair and, on this basis, conclude the correlated asset. The more trades are moving in one direction, the higher the probability of establishing a new trend, which means that the chances of a successful outcome also increase.
Moreover, as currencies are expressed in pairs, like the GBP/USD pair includes both US dollar and pound, the correlation will help measure the strength of this or that currency, individually.
Let's look at the example so it will be 100% clear. USD/CAD has a negative correlation with GBP/USD of -0.9. As we have already mentioned, the negative correlation entails that assets are moving in the opposite direction. So, placing the same orders (buy or sell) for these two currency pairs will make no sense.
Speaking about the first one, the USD is the base currency (when you place a buy order with this asset, you are sure that the USD rate will increase against the CAD). As for the second one, the USD here is the quote currency (when you place a buy order with this asset, you expect that the GBP rate will increase against the USD). Basically, opening a short position with the GBP/USD trader anticipates the USD to decline, and opening a long trade with the USD/CAD indicates the expected increase of USD.
Taking into account the incredibly huge correlation between the two pairs in the context of the currency strength, it is logical to conclude that the USD (the very currency that unites these two assets) is making those fluctuations. Consequently, the USD can be called the strongest currency from the ones we have discussed above.
The Advantages of Using the Real Currency Strength Meter

Implementation of a correlation matrix in terms of the currency strength meter carries a lot of benefits. Let us have a look at some of them, so you will make sure that it is an essential indicator in the toolkit of each trader.
- Useful, short-term currency strength indicator
One of the advantages of the Forex currency meter is that it can be employed as an indicator of short-term movements. It can be really effective as a benchmark for determining which currencies are showing signs of improvement, making them valuable for the right timing of trading decisions. By the way, it is a good way to verify the signals provided by some other indicators with the help of a currency strength meter.
- Currency strength meters are simple
Another crucial benefit of a strength meter is its simplicity of use and understanding its signals. It should be a decisive point, namely for novice traders since there is no need to read and interpret some complex data. You don't have to be a professional trader with ten years of experience to follow the simple and understandable graphical indication of the falling or rising currency.
- Correlations matrices eliminate double exposure
Like you already know, currency pairs that have positive correlation move in an identical direction. Obviously, because of that, you should not place orders with the currency pairs showing a high correlation since it is actually the same order. If you still do so, you put your account at risk since the market can start moving in the opposite direction. In case if you place sell orders with the GBP/USD, EUR/USD, and AUD/USD, you risk double exposure because these assets are profoundly correlated.
With the help of a correlation matrix, it is easy to have a look at it to see the correlation of particular currencies. Make sure to double-check with it, just in case. It will help you to dodge opening the same positions from the very beginning, as well as the double exposure to a weak currency.
- Forex strength meters eliminates unintentional hedging
The next advantage of the strength meter is the elimination of unintentional hedging. For instance, if you know beforehand that there is a negative correlation between GBP/USD and USD/CAD, you are aware that these assets are leading in opposite directions. Accordingly, in case there is a sell order on both of them, you will definitely lose money on one of them while getting profit on the other. Simple as that.
- Currency strength meters signal high-risk trades
Another good thing about the correlation between assets is that it can be used as some kind of risk meter, here is what it means. Let's say we are placing a short position with the GBP/CHF and GBP/JPY, and as we know they are positively correlated. So, from that, we can understand that placing the same order with correlated assets will do nothing but double the potential risk. Since the market can always move against the trader and two short positions is not something professional traders will do.
How Does the Forex Currency Strength Indicator Work?
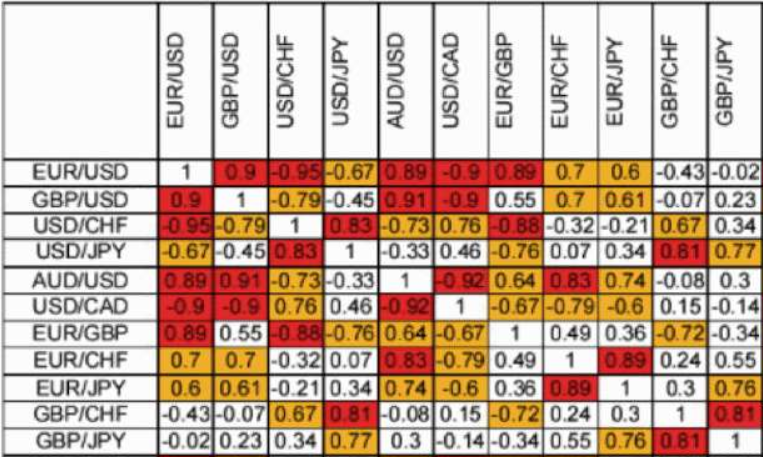
So, before moving to the use of a currency strength meter, let us quickly go through the correlation matrix itself. Understanding the currency correlation matrix will allow you to avoid dangerous mistakes in making trading decisions. The importance of correlation in medium and long-term trading is particularly high.
Basically, in the above-mentioned matrix you can see the following currency pairs:
EUR/USD - Euro vs United States Dollar
GBP/USD - Great British Pound vs United States Dollar
USD/CHF - United States Dollar vs Swiss Franc
USD/JPY - United States Dollar vs Japanese Yen
AUD/USD - Australian Dollar vs United States Dollar
USD/CAD - United States Dollar vs Canadian Dollar
EUR/GBP - EUR to GBP - Euro vs Great British Pound
EUR/CHF - EUR to CHF - Euro vs Swiss Franc
EUR/JPY - Euro vs Japanese Yen
GBP/CHF - Great British Pound vs Swiss Franc
GBP/JPY - Great British Pound vs Japanese Yen
As we have already mentioned, a positive correlation is one where assets' prices show the same direction of movements, and the negative one is when the assets move in the opposite direction.
Considering the table given above, you can see that there are three types of colors showing the different level of the strength of dependence between the assets:
White: Little or no correlation (positive or negative);
Orange: Medium correlation (positive or negative);
Red: Strong correlation (positive or negative).
With the help of this correlation matrix, it will take you a few moments to have a look at the table and to see which currencies show either a weak or strong correlation between each other.
Here is how to interpret the data given in the correlation matrix:
White boxes: these include the assets with little or no correlation. There are both negative and positive ones, and since this level of correlation has no influence on your trading positions, no need to pay attention if it's negative or positive. Let's say you open positions with EUR/CHF and GBP/CHF. Given that the correlation here is just 0.24, it doesn't matter which type of correlation it is - assets will move independently from each other.
Orange boxes: here you can see the currency pairs with the medium correlation, up to 0.79 (either positive or negative). Now you will need to take into account this correlation when placing orders and look carefully if it's negative or positive. For instance, if you place orders with the EUR/USD and USD/JPY (and the correlation is -0.67), you should know that the same type of orders (either sell or buy) will cancel each other. On the other hand, if you place opposite orders with these two assets, profit most likely will be the same, but keep in mind the exposure of risks.
Red boxes: these boxes highlight the currency pairs with a strong correlation up to 100, either positive or negative. As for these, each trader should check carefully for strongly correlated assets in order not to mess up the trading account. So, let's say you want to open positions with the GBP/USD and AUD/USD. After checking the correlation matrix, you will know that the correlation between them is extremely strong, reaching 0.91. Armed with this information you will know that it is better not to place the same orders with these two due to the increased risk. Additionally, if you place the opposite orders with these financial instruments, positions will cancel each other because they have a positive strong correlation. With the negative correlation, it's the other way around.
Basically, traders can get a lot of information if they know how to interpret the Forex correlation matrix.
In the given table, you can see that the USD shows its strength with the -0.95 correlation between USD/CHF and EUR/USD. Henceforth, if you open the same positions with these currency pairs simultaneously, they will cancel each other. Placing the same orders, on the other hand, will double the profit, or risk, depending on the accuracy of the signal that made you place those orders. Speaking about the currency strength, USD here is the strongest one.
If you look at the AUD/USD and EUR/USD, you will see that the correlation here is positive and equals 0.89. With that information in mind, you will know that placing the same orders here doubles the profit (or risk) since these currency pairs tend to move in the same direction. And, consequently, if you open positions with different directions, they will cancel each other.
However, the market does not want to please us with stability and is in a constant state of excitement. As a result, even the strongest correlations, which can last for months and years, sometimes change, and at the most inopportune moment. What is a correlation this month may be a different story in a new month. So make sure to double-check everything before placing orders.
How to Use the Currency Strength Meter
As you have guessed, the logic behind the currency strength meter is crystal-clear - buy a strong asset and to sell the weak one, simple as that. In cases when let's say, EUR/GBP soars, but it's unclear if it`s happening because EUR is strong or because GBP is weak, right? With the help of this indicator, you will be able to determine the reasons for that rally.
Green boxes indicate the currencies that have dropped lower in value against the base currency;
Red boxes display the ones that have increased higher in value against the base currency;
The Grey boxes show minimal fluctuations.
The lighter the color, the smaller the fluctuation against the other currency; and another way around.
The currency strength meter is a great way to define which currencies may be worthy to trade on, as well as which ones should be avoided
For instance, if one currency is very strong, and the other suddenly weakens, it can be an opportunity to enter the market. This deviation indicates strong momentum. And vice versa, if both currencies are weak or strong, it signals the sideways trend, which means that it is better to pass this trade.
How to Get the Most out of the Real Currency Strength Meter
Needless to say, currency correlation is not and cannot be used as the only way to analyze the chart and make trading decisions. Still, it can be implemented as a confirmation of some other signals and the way to reduce the trading risks. Follow the following tips to get the most out of the currency strength meter:
Do not place the same orders with the negatively correlating currency pairs. As we have mentioned above, by doing so, you increase risk and reduce the potential profit drastically, plus positions can cancel each other.
Reduce risks through diversification. If you open positions with the positively correlating currency pairs (on the condition that the signal is accurate), you will increase the profit and decrease the risk.
Hedging. If you have a losing trade, you can place the opposite order with the other negatively correlating currency (it must be a strong correlation). Of course, the risk will not vanish, but in such a way, you can reduce it to a minimum, rather than losing the whole trade.
Conclusion
Profitable trading is due to several different factors, including the strength of currency instruments. The price movement on the market is based on an imbalance of these forces. Today we have considered one of the "non-standard" but very informative indicators. Knowing which of the selected currencies is stronger can be a great hint for a trader. Although it is considered to be a "veteran" it still helps a lot those who know how to use it and trade several currency instruments at once. With it, you can easily determine the trend direction and activity of currencies to understand which currency is more profitable for you to trade today.


