
Over the past years, many ignored the US yield curve as the Federal Reserve kept interest rate near zero and supplied three rounds of quantitative easing. This was done in reaction to the 2008 global financial crisis and the U Great Recession which followed. The US central bank hoped to buy the economy enough time to heal and grow on its own. Since the Fed ended its QE purchases and started to increase interest rates, the yield curve started to slowly become more interesting. The 2-year/10-year yield curve inversion has often been a precursor for the next recession, but with an average lag time of 17 months.
So far, only the 3-year/ 5-year yield curve inverted while the 2-year/10year spread shrank to as low as single digits and has not yet inverted. The interest rate increases by the Fed together with a slowdown in economic growth and a spike in market volatility have all contributed to the contraction. Yields move opposite of price which means a lower yield equals a higher price in Treasuries. Since the US Fed has artificially impacted financial markets in the US and globally for almost a decade, things may be slightly different this time around.
Lee Ferridge from State Street argues that “Zero isn’t zero in this world in terms of the curve. To say it’s a real recession signal I think you have to be much more negative than just below zero.” Given uncharted territory due to the Fed QE program, we may see the US slide into a recession prior to a yield curve inversion in Treasuries. Some analysts claim that a deep inversion would be more worrisome. Jim Caron, from Morgan Stanley Investment Management, stated that “I would say the signal strength for the yield curve to predict a recession would increase substantially at around -20/-25bps.”
Such a deep inversion may appear a lot faster given the speed at which the 2-year/10-year spread contracted from 79 basis points in November to 9 in December. Will presumed macro financial QE impacts be correct? How long will it take for forex traders to adjust their US Dollar positions to the US yield curve inversion? Open your PaxForex Trading Account now and start building a strong portfolio for a better tomorrow.
The economic picture for the US is deteriorating a lot faster than previously expected and the US Dollar is coming under pressure which may force a breakdown in price action. Many fail to ignore the psychological impact on traders once the 2-year/10-year yield curve inverts. Subadra Rajappa from Societe General noted that “Last time it was Greenspan’s ‘conundrum’ and outsized foreign demand for Treasuries and this time it’s QE. But an inversion is an inversion regardless of what technicals are driving the long end of the curve.” The Fed already sounded more cautious about its interest rate ambitions for 2019. How deep will the US yield curve inversion be? Time will tell, but here are three forex trades which will yield you great profits.
Forex Profit Set-Up #1; Buy AUDUSD - D1 Time-Frame
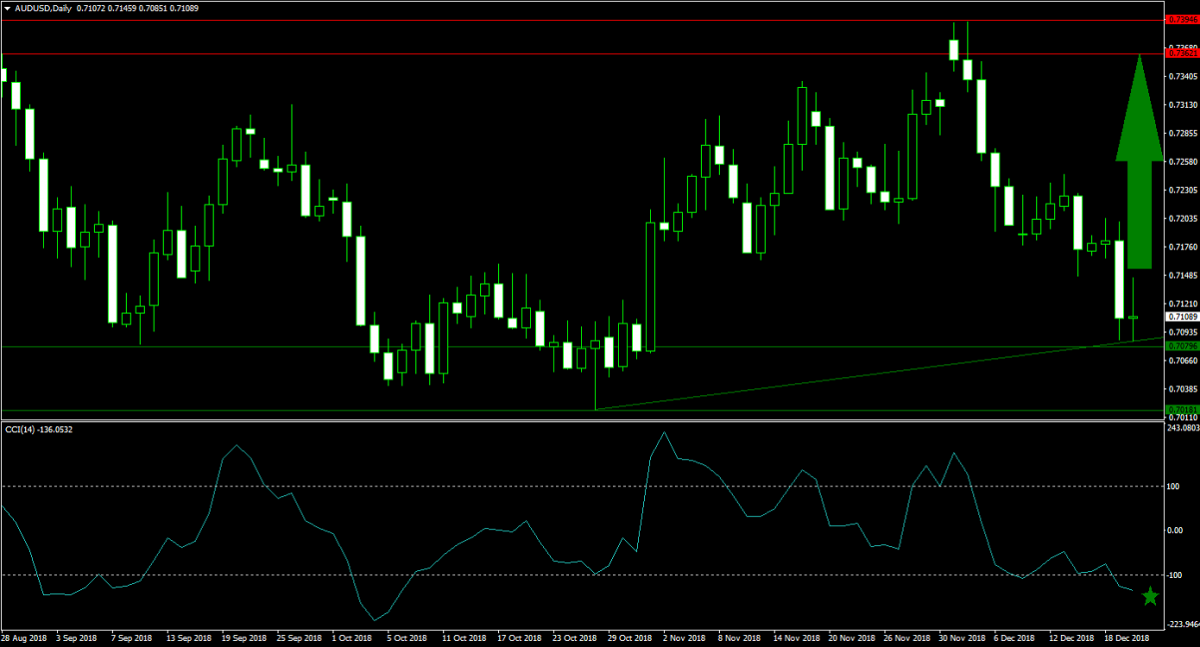
The AUDUSD completed its corrective phase which took it down from its horizontal resistance area to the upper band of its horizontal support area. Price action is now additionally enforced by its primary ascending support level. The US and China remain entangled in a trade war started by the US and forex traders use the Australian Dollar as a Yuan proxy. A reversal of the contraction, partially powered by short-covering, is expected and forex trader are advised to buy the AUDUSD above its primary ascending support level.
The CCI descended into extreme oversold territory, but remains off of its previous lows. A move above the -100 level may ignite a short-covering rally which will fuel price action to the upside. Follow the PaxForex Daily Forex Technical Analysis and simply follow the trading recommendation of our expert analysts; we do the hard work so that you may profit easily!
Forex Profit Set-Up #2; Sell USDNOK - D1 Time-Frame
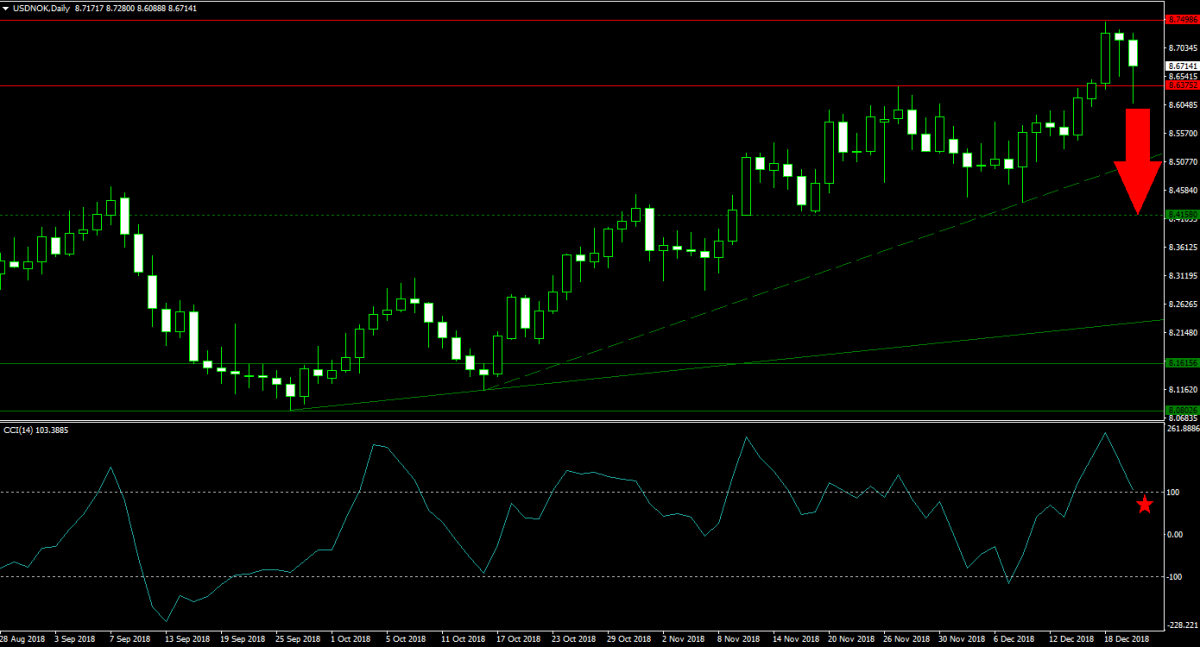
The currencies of Denmark, which continues to boost negative interest rates, as well as Sweden, which remains without a government, have already strengthened against the US Dollar. The Norwegian Krone is lagging this move, but stared to test its horizontal resistance area to the downside. A double breakdown is anticipated to follow over the next few trading sessions which will push the USDNOK below its secondary ascending support level and into its next horizontal support level. Selling the rallies from current levels is favored.
The CCI remains in extreme overbought conditions, but is accelerating to the downside fast. A drop below the 100mark is expected to attract more sell orders in the USDNOK and initiate a sell-off. Subscribe to the PaxForex Daily Fundamental Analysis and allow our expert analysts to guide you through the forex market; earn over 500 pips per month in profits!
Forex Profit Set-Up #3; Buy XRPUSD - D1 Time-Frame
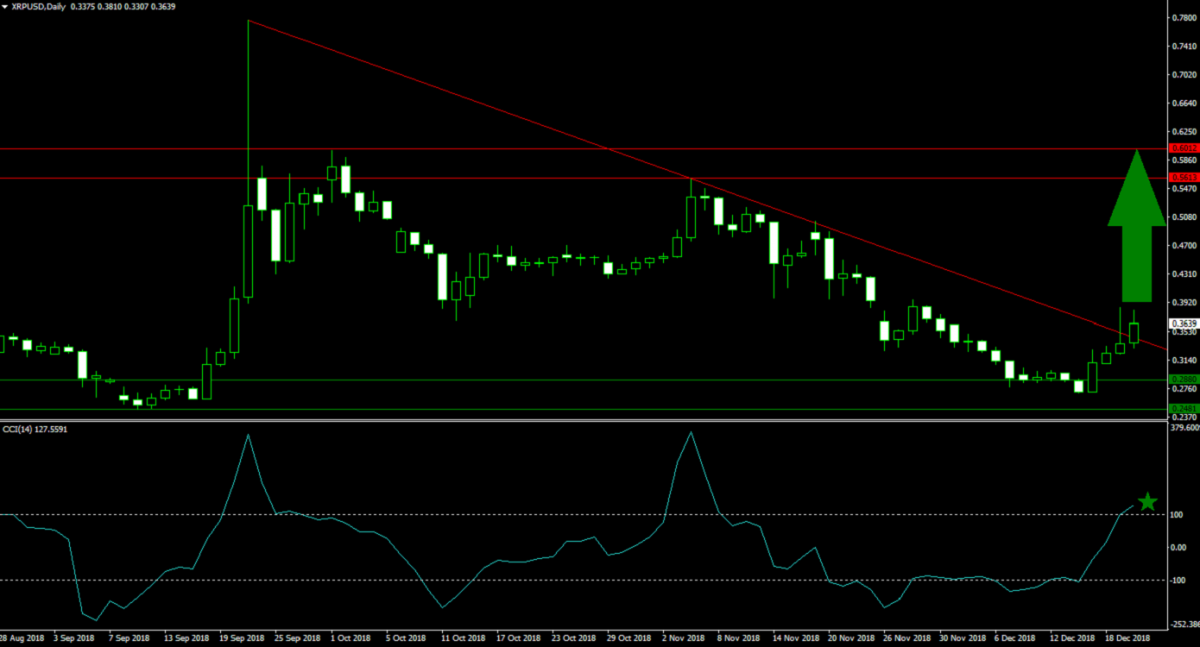
While the US Dollar is coming under pressure, cryptocurrencies have mounted a comeback and are reclaiming key support levels. After briefly sliding into its horizontal support area, XRPUSD reversed and completed a breakout. Bullish momentum was strong enough to push this cryptocurrency above its primary descending resistance level which further added to the rise in bullish sentiment. The path is now clear for XRPUSD to rally into its next horizontal resistance area and traders are advised to buy the dips down into its primary descending resistance level which is now acting as support.
The CCI quickly advance from extreme oversold territory into extreme overbought conditions, but it remains far off of its two previous peaks which means that this momentum indicator has more room to advance. Download your PaxForex MT4 Trading Platform today and join our growing community of profitable forex traders!
To receive new articles instantly Subscribe to updates.