Forex can be complicated and difficult to follow. But it can also be quite simple, if you have the right approach. While some traders dive into the depth of detailed political and economic analysis of the market, others minimize the amount of supportive tools and trade with nothing but a bare chart. These strategies are categorized as Forex price action trading and today we will discuss everything you might need to know about successfully implementing them. In this post you will find out about:
The advantages of technical analysis over the fundamental one
What is price action on Forex
Why traders chose price action over other approaches
How to trade price action in Forex
3 price action strategies
Pro tips on using price action strategies
Kindly note that this is one of the many discussions of various trading methods on Forex. Take your time to learn about each strategy and choose the one that fits you most.
The Advantages Of Technical Analysis
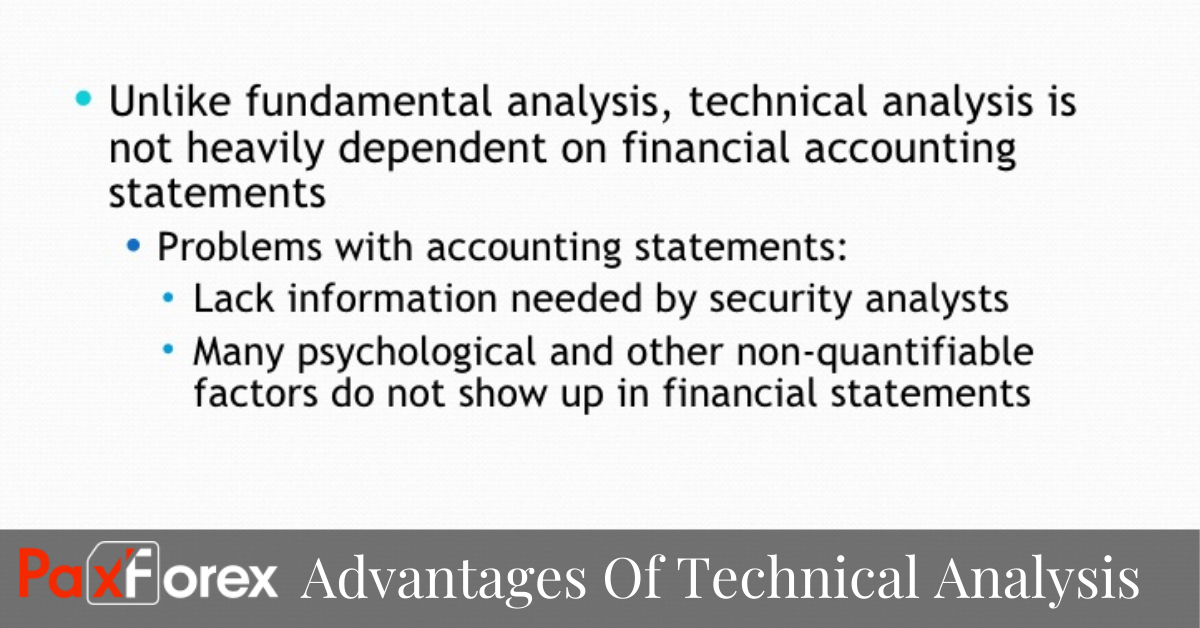
Technical analysis of the Forex market is the most straightforward way to look at how a certain situation unfolds. Technical analysts focus directly on the price of the currency, partially disregarding the external aspects that might have affected its formation. This approach is believed to take up less time and provide the clearest picture for the traders.
With that said, it is important to mention that the fundamental analysis also has a lot of ground to stand on. Fundamental factors, such as economical, political and social events around the world majorly influence the price movement. This majorly happens for one reason: traders are the ones who move the market and their reaction to specific events can serve as a big driver.
That is why fundamental analysis takes up a large spot in the world of online Forex trading. There are numerous sources of updates, courses on how to perform your own fundamental analysis, specifically dedicated blogs and so on. But even the most devoted fundamental traders tend to cross-check with the technical indications.
As a world-famous multi billionaire trader Bruce Kovner once said: “Fundamentalists who say they are not going to pay attention to the charts are like a doctor who says he’s not going to take patient’s temperature”.
Besides, there are some clear advantages of the technical approach over the fundamental one from a variety of angles. Here are some of them:
It’s for everyone. All cards on the table - technical analysis is easier to attempt than the fundamental one. It is all in the name: technical analysis is very technical, meaning that in order to perform it you have to go through a pre-established set of steps and instructions. Fundamental analysis, on the other hand, requires you to dig well deeper and learn about things like politics and international relationship. Needless to say, not everyone has time or interest to learn about other countries’ politics.
It’s faster. Depending on the technique you are using, technical analysis can take up anywhere from several minutes up to an hour. And as long as you stay systematic and organized, it will quickly become a simple routine. The most important thing is to stay focused and learn to filter out what is actually crucial to your trading process from what can easily be ignored. You might have some trouble with that at first, but it will absolutely come to you the longer you trade.
It’s accessible. This one basically means that any tool you might need to perform technical analysis is probably already in your possession. If you are trading with the Metatrader 4 platform, you have access to every commonly used chart type, including bars, lines and candles, to nine convenient time frames and to over 50 built-in technical indicators. This is more than enough to successfully run technical analysis, and as you will learn later on, you might not even need some of what we’ve mentioned.
It’s effective. There is a reason why so many traders around the world choose to use technical analysis over the fundamental one in their decision-making process. It is because it actually works. Even the most detailed and sophisticated fundamental analysis has a chance of turning into a waste of time if the market goes on an unexpected leap. But for the technical analysis any move, whether expected or random, is just data that can be analyzed and benefited from.
It’s versatile. The discussion about technical analysis can go on and one due to it being a very flexible approach. Every trader has an opportunity to come up with their own way of interpreting the market data, by noticing previously undescribed patterns or by using advanced math to predict the upcoming movie of the market. While the foundation remains the same - technical analysis looks at the situation at Forex from the perspective of price chart formation, the way you use it is totally up to you.
Now that we know that there are some really strong points to master the technical analysis before you even consider moving onto the fundamental analysis, we are going to move on to the main theme of today’s discussion - Forex trading price action strategy.
What Is Forex Price Action Trading
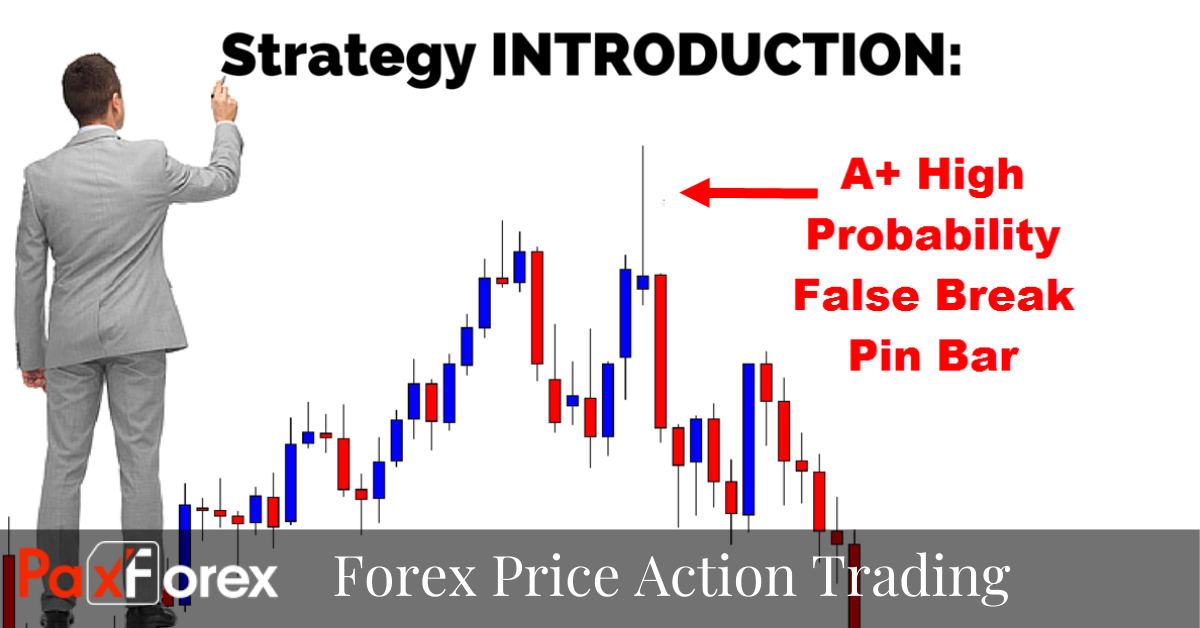
Price action trading, often abbreviated into PAT or PA, is the most common approach to technical analysis based trading. It is built around very simple logic, that serves as the foundation of all technical analytics: all you need to know about the currency is communicated through its price. Meaning that whatever happened outside the market itself and whatever has affected the price movement, the current value of the currency contains the outcome of all the factors.
In price action trading traders look at the bare chart - without any additional supporting add-ons. Price action traders believe that the usage of multiple trading indicators clutters the chart and distracts from what actually matters. Although they might sometimes use the occasional simple moving average to indicate the potential levels of support and resistance, PA traders tend to keep the chart as clear as possible.
By studying the current chart and comparing the past data from earlier, price action traders create strategies that are believed to deliver high profitability and high probability - the two most desired characteristics all across the market.
Before we go into the technicalities of price action Forex trading, let’s first briefly talk about why exactly so many traders choose price action over other approaches.
Why Traders Choose Price Action Over Other Approaches
We have already mentioned that price action trading is one of the most popular manual trading approaches at the modern market. While some traders, who are devoted to more complex strategies, say that PA is oversimplifying the trading process, there are several strong points to argue that statement. Here are several reasons to consider this method we’ve got from professional price action traders:
Straight to the point. Using multiple indicators can work great for a number of strategies, but price action traders think that it is a major distraction. Looking at the price chart as is it can already provide plenty of useful information that can allow you to judge the overall condition of the current market and forecast the upcoming movies and trends.
Time and effort efficient. Why spend the majority of your time trying to analyze life out of the chart when you can be trading and profiting instead? Same reason why technical analysis is faster than the fundamental one, price action approach is one of the most time-efficient subcategories of technical analysis. This is due to the fact that traders do not invest any effort in first setting up a number of tools and then trying to read the chart correctly.
Fewer variables. Technical indicators can definitely provide with more insight on the current situation, but they can also confuse the way a trader thinks and end up with providing more options than needed. While advanced pros know where and what to look for, beginners often get overwhelmed with unnecessarily spread possibilities and start acting irrationally.
As a bottom line, PA traders often refer to their strategy of choice as the most OG approach to technical analysis. They are not entirely wrong, since most of the tools and add-ons we implement in our everyday trading operate from price action principles. Next let’s talk about the steps you need to take to successfully learn price action Forex trading.
How To Trade Price Action In Forex
There are several basics you will need to fully comprehend and master before moving on to any kind of trading strategy and the price action trading in particular. To fully understand how to trade price action in Forex, you will need to begin by studying market charts: what do they look like, how they form and what can they mean.
There are three most commonly used types of the price charts on the Forex market: line chart, bar chart and candlestick chart. Line chart is the most basic type that consists of a single broken line that connects all the closing points over the chosen period of time. This type of chart gives a good idea of the general condition at the market, however some find it too abstract. Yet there are also a lot of trades who are perfectly fine with using the line chart along with several additional drawing instruments.
Bar chart is somewhere in the middle between the line charts and candle charts. They still appear rather minimalistic, but carry more data than the lines. Each bar consists of three elements: a vertical line and two horizontal markings, one facing right and one - left. These markings are often referred to as feet. The bar will inform the trader on four main points: what were the highest and the lowest points and what were the opening and closing prices for a particular currency pair in the selected time period. The bars can vary in length and color, depending on whether they are bullish or bearish and form in the specific directions, outlining trends.
While both line and bar charts can be used in price action trading, the most popular chart in general and in this particular approach is the candlestick chart. Candles might look like the chubbier versions of bars, and they essentially carry the same information: highest and lowest price points and the opening and closing prices within the specific time period. The major difference between the bars and the candles is that the distance between the open and the close prices on a candlestick is filled in, thus forming a shape that resembles a candle.
Candle charts are believed to be the easiest to read, as they very clearly help identify the trend and provide all the required information on the currency. Being able to correctly read the chart is a very important task for the trading beginner. To make the job a bit easier, here are some aspects to consider, while reading the candle chart:
Learn all the elements and practice differentiating bullish candles from bearish ones. When you look at the standard candle you see a vertical rectangle with two vertical lines at the top and at the bottom. The vertical lines can be referred to as shadows or as wicks, the top one indicates the highest price point, and the bottom one - the lowest. Now, the close and the open can be located both at the top and bottom, depending on the candle type. Bullish candles (often displayed as green) appear when the closing price is higher than the opening one, meaning that the asset is rising in value. Bearish candles appear under the opposite conditions: when the closing price was lower than the opening one, meaning that the asset is dropping in value. Depending on the timeframe setting, one candle represents a specific time segment. For example, on a daily chart one candlestick carries information about one hour and on a monthly chart one candle is one day. Get comfortable with the set up and the color coding of your chart before you move on and the rest will come naturally.
Study and memorize the textbook candle patterns. It is a known fact that Forex is repetitive and runs in specific patterns. For traders this means that by learning to spot those patterns and react accordingly they can always stay on top of the game. This part is actually kind of fun. Both single and multiple candle patterns have very distinguishable names that certainly help memorize them. For instance, a candle that looks more like a plus sign is called Doji star. Depending on the data the Doji indicates it might come in several other shapes and carry certain meaning. This way, a Doji hat looks like a capital T is called Dragonfly Doji and can mean that the price will change direction and is often read as a bullish signal, while the upside down T is called Gravestone Doji and is also read as a reversal sign but this time to the bearish side. The more time you spend looking at the market from the pattern perspective the sooner you will realize that some of them happen more often than others and this will make your job easier.
Know trends from consolidations. If trend on the Forex market is a sequence of higher highs or lower lows one after another, consolidating is the price behavior when it seems to be stuck in a horizontal corridor. The price still moves up and down but the location of consecutive lows and highs is not significant enough to be considered a trend. There are strategies that were designed to benefit from consolidations, but the outcome will not be as significant as with trend oriented trading. Trades have different ways of predicting when the price will exit the corridor and strive in a certain direction, forming a trend. One of the ways to tell is to pay attention to the size and amount of candles inside the consolidation channel, especially the ones towards the end. If the channel is dominated by bullish candles, for example, the upcoming trend will most likely also be bullish.
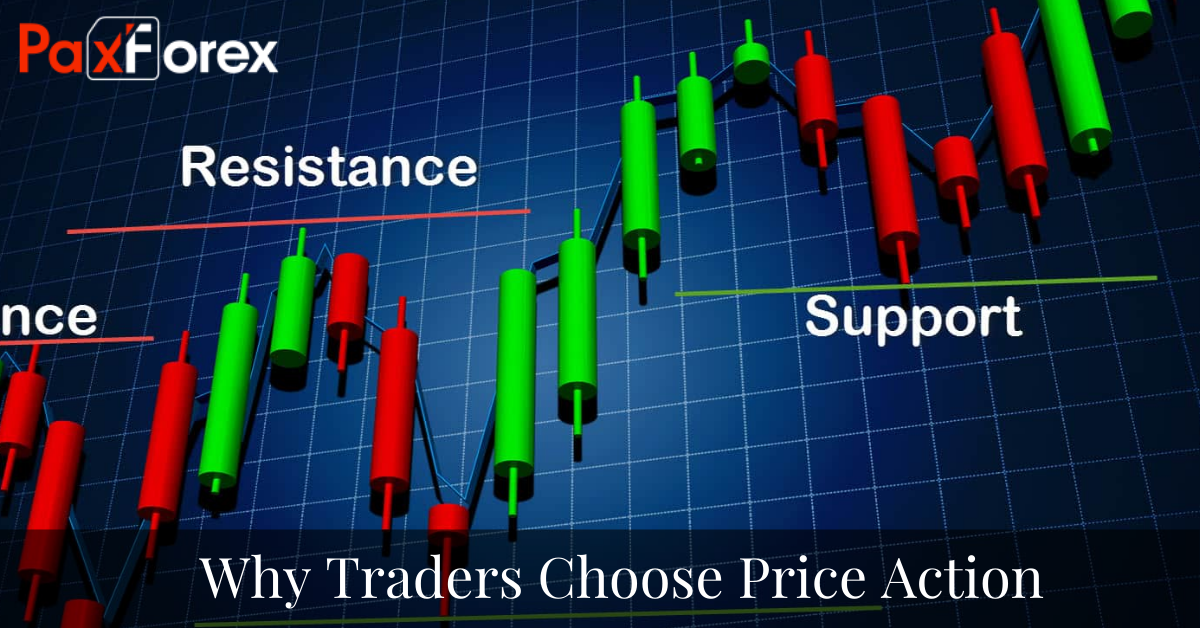
Use the drawing tools to help sort out the chart. Price action traders do not like to clutter up the space with numerous indicators, but they still very much use the drawing tools for support. The simple line tool can assist in outlining trend direction, defining the potential levels of support and resistance and establish the setup coordinates for pending orders inside each trade. Drawing tools exist to help you better visualize the trading process and as learning tools as well, for example when bloggers record their trading sessions for educational purposes.
Learning how to read candlestick charts on Forex might take up some time, but remembering the key elements and memorizing some or all possible patterns definitely helps along the way by allowing you to save time analyzing and think more clearly. Moreover, many expert traders claim to see certain beauty in the way charts form and its elements interact with one another. This means that with enough practice and experience you will find that reading chart patterns is not only easy but also enjoyable. At this point we are pretty much done with the basics and it is time to move on to Forex trading price action strategy possibilities.
Three Forex Trading Price Action Strategies
A trading strategy is a set of instructions a trader chooses to follow to achieve a certain goal. The strategies work by a very straightforward principle: the reason, the steps and the outcome. The reason should ideally explain why the trader thinks this is a good time to place a trade. For example, a certain candle pattern or a specific trend can serve as a reason to place an order.
The steps of the strategy are exact instructions on when to enter, how to act and when to exit. They are usually very specific and have to be followed religiously, otherwise adopting a strategy won’t make much sense. Traders can choose from a variety of existing trading instructions or create their own, what is important is that the steps are clear and reasonable.
The result of the strategy is not necessarily the final outcome. It is better described as a goal or a target - what is the trader trying to achieve by going in. Knowing exactly how much you are aiming for helps to find the most appropriate exit spots, implement risk management techniques and also motivate the trader. Keep your result expectations realistic and achievable in order to have the clearest vision throughout the trading process.
Three strategies presented below are just a few of the many available price action trading methods. Here we have gathered the approaches that in our opinion are the easiest to follow and tend to be the most effective in many scenarios.
Trend lines strategy
- Instruments (currency pairs): Any
- Timeframe: Any
- Trading sessions: Depending on the instrument
- Indicators: None
The trend line strategy is based on a very simple principle: the price movement can either stay restricted within the trend limits or break through them. The limits are defined by the virtual restrictions - trend lines, that serve as support or resistance, in a way. In order to use this method a trader has to draw the trend lines on their own.
To draw a trend line you need at least two consecutive higher lows for an uptrend or two lower highs for a downtrend. Using a line tool in MT4, connect the two or more swing peaks (either top or bottom) and continue the line under the same angle. This line will serve as a boundary for the trend. This strategy is applicable in the scenario when the price bounces off the trend line, without breaking out.
To go long (buy) you will need an upward trend line, that you created by connecting two higher highs or two higher lows. Then wait for the price to approach the line. Place a buy stop approximately 3 to 5 pips above the high of the candle that touched the trend line. The stop loss should ideally be located about 2 to 5 pips below the same candle. Your profit target can be based on the previous swing peak or on a 1:3 risk to reward ratio.
To go short (sell) do the same first step but for a downtrend. Once again, the price approaching your trend line is a signal for a trade. Place a sell stop 3 to 5 pips below the candle that touched the trend line and the stop loss 3 to 5 pips above it. Take profit is based on the previous swing’s low.
The major tip for the trend line strategy is to look out for reversal signaling candlestick patterns that we have mentioned earlier, such as Doji, Shooting Star, Hammer or Harami. They will serve as a confirmation that the trend is indeed about to bounce off and not break through the trend line.
Additionally, consider trailing your stop and moving the stop to loss, if you are planning to go along with the trend for an extended period of time. Considering your trend line setup is done correctly, this strategy may allow you to buy low and sell high with minimum effort during the actual trading process, plus the risk to reward ratio is very reasonable.
The biggest disadvantage of this strategy is the scenario when the price does break through the trend line, but the good news is there are strategies that can be implemented then.
Support and resistance strategy
- Instruments (currency pairs): Any
- Timeframe: Minimum 15M
- Trading sessions: Depending on the instrument
- Indicators: None
Horizontal levels of support and resistance serve as a base for dozens of effective Forex strategies, since they are based on one of the market’s primary characteristics - repetitiveness. There are a number of ways to determine your support and resistance levels, some are complex like using the Fibonacci sequence, for example, and others are a bit more straightforward.
To determine your support and resistance levels simply look at the chart and notice the spots where the price tends to reverse. This will be the lowest lows and the highest highs. If you use a drawing tool and connect them with a line you will most likely see that the price tends to stay within a specific limit. The more times the price has bounced off either of them - the stronger are the levels of support and resistance. And by knowing when the price is going to reverse is obviously all we need for a successful trading session.
To go long you will need for the price to first bounce off the level of resistance (top line), then reach the level of support (bottom line) and from there you can choose one of the three options: placing a buy stop 3 to 5 pips above the candlestick that touched the support line, placing a buy limit order to automatically activate the trade when the price hits it or buy immediately at the current market price. Stop loss will generally be anywhere from 15 to 30 pips below the support level and the take profit will ideally be at the level of resistance or slightly below it.
To go short, the price has to reverse at the support level and after it touches the resistance there are also three available solutions: placing a sell stop 3 to 5 pips below the candlestick that reached support, placing a sell limit and wait for the trade to activate automatically or sell immediately at that market price. Depending on the timeframe the stop loss should be located between 5 and 20 pips above the resistance level. The general rule on Forex is the bigger is the frame the higher are stop losses and take profits.
Same suggestions apply in this strategy: consider trailing your stop, get familiar with the reversal candle patterns and consider closing a half of your position if the price went out the level boarders but hasn’t reached the stop loss yet.
Shooting Star strategy
- Instruments (currency pairs): Any
- Timeframe: Any
- Trading sessions: Depending on the instrument
- Indicators: None
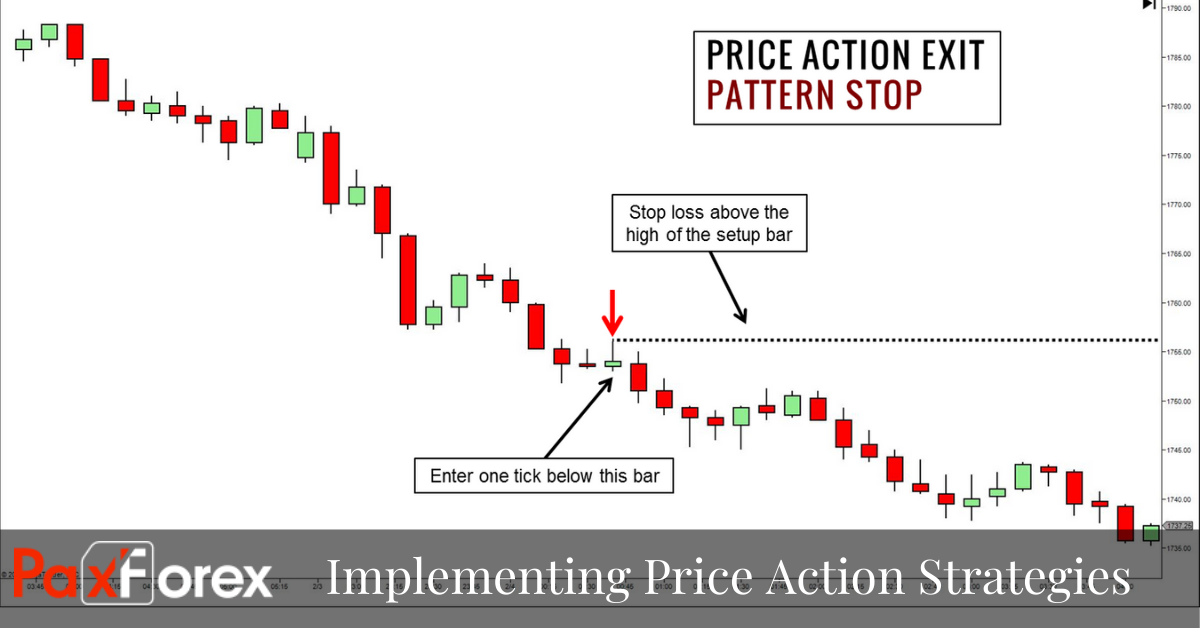
The Shooting Star candle is a formation that looks like an upside down Hammer - a box with a long vertical line on the top. Shooting Stars can be both bearish and bullish, but the bearish ones are considered higher probability signals for the market heading down. These candles form when the bulls were trying to get the price at a new high, but their push was not strong enough, which resulted in bears stepping in.
In this particular strategy going long is not considered, but the same instruction frame can apply to the Hammer pattern based strategy - the bullish counterpart of the Shooting Star. Although, the short term traders, such as scalpers can definitely still benefit from going long in this situation, by implementing a trend line strategy and waiting for the next hit of the limit.
To go short wait for the price to close below the bottom level of the Shooting Star by using a pending order or immediately selling at the market price. The stop, very logically, is going to be located at the top point of the Shooting Star and the profit can be drawn at either the level of support or based on the chosen risk to reward ratio.
Just as any pattern-based strategy, this one requires close attention to detail and an ability to think fast. Stay focused and notice the candles that form after the Shooting Star, as they may signal that the market won’t stay in the new state for very long, therefore signalling you to either process a quick trade or wait for better conditions.
Pro Tips On Implementing Price Action Strategies For Forex
Just before we wrap up, let’s quickly go over several things to keep in mind for successful implementation of price action Forex trading strategies. The very first one is to get comfortable with the trading platform beforehand. Metatrader 4 is both very effective and user-friendly, however it might still take you several days to fully get a gist of it. One of the best solutions is to get yourself a copy of the MT4 user guide and read it through to get a full understanding of the technical lingo as well as of function sequences and personalization options.
To always keep your head in the game, no matter where you are, consider installing an MT4 app to your smartphone or tablet. This way you will make sure that every promising opportunity is seized in a timely manner. Additionally, since price action traders like to have their charts clean, mobile versions are designed to display simplicity, while still being as effective as the desktop version. Trading from your phone can be a great optimization of your free time, for example on the long commute to work or while waiting in the line.
If you are completely new to trading or if you have been trading for a while, but only now considering trying out the price action trading, the best way to get into it without risks or deposits is by opening a demo account for Forex trading. Demonstration accounts are trading simulators that allow traders to perform any trading related task, without paying anything. Demo account is designed to replicate an online trading account perfectly, including all the chart types, every timeframe, all tools and indicators. The prices displayed in the top left corner are also taken directly from the live market. This means you can open and close any position and not worry that something might go wrong. It is a great option for choosing a strategy to work with or for inventing your own trading method. Open a free demo account right now to try the price action trading in action.
Forex Price Action Trading Summary
Price action trading is popular for a reason. There are many professional traders, who stick to this approach despite their knowledge of the market and experience. There is a very simple explanation: price action is built on the basic principles of Forex, such as: the price runs in patterns, technical information by default carries all contributing factors and the price chart contains everything you need. Unlike other strategies, PA sticks to the simple approach, which makes it very attractive for trading novices.
But it is still important to remember, that no matter how simple a strategy seems to be, it still requires a trader to respectfully prepare. Learn the professional trading language, consult with your broker on any matter that interests you, select the right trading account type and try out a good amount of strategic approaches before sticking to one. This way you can become a trader who is both profitable and knowledgeable enough to keep growing the capital and optimizing the trading process.


