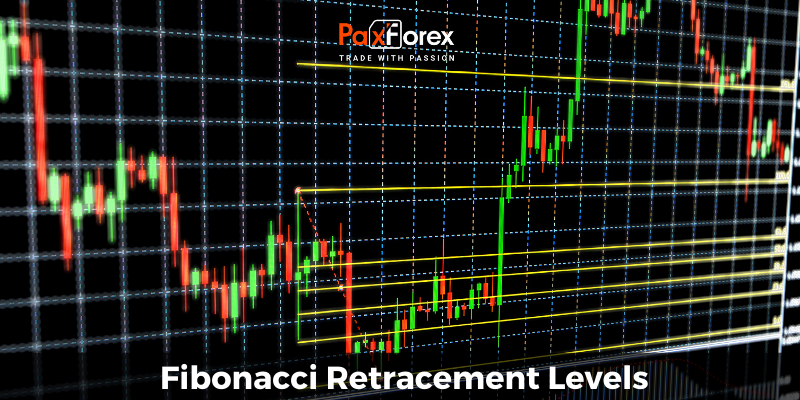
As you study more about forex trading and especially technical analysis you will come across a technical term called Fibonacci Retracement Levels. It is a very popular indicator for major support and resistance levels and plenty professional traders use those levels as part of their overall trading strategy as the Fibonacci sequence is a very accurate sequence when it comes to trading.
What is the Fibonacci sequence?
The Fibonacci sequence was introduced by Italian mathematician Pisano Bogollo to the Western world and can be found throughout math, science, architecture and nature. In essence it is a serious of numbers which starts with 0 and 1 which are added together and the results will be added with the previous number.
Here is an example:
- 0 + 1 = 1
- 1 + 1 = 2
- 2 + 1 = 3
- 3 + 2 = 5
- 5 + 3 = 8
- 8 + 5 = 13
- 13 + 8 = 21
There is no end to the sequence and there are plenty of very unique mathematical relationships embedded in the Fibonacci sequence such as:
- Starting from 34 each number divided by its previous number rounds up or down to 1.6180
- Starting from 34 each number divided by its next number rounds up or down to 0.6180
- Starting from 34 each number divided by the number two places ahead rounds up or down to 0.3820
- Starting from 34 each number divided by the number three places ahead rounds up or down to 0.2360
The Golden Ratio or Phi relates to 1.6180 as well as it inverse number 0.6180 Since financial markets and trading deals with numbers, the Fibonacci sequence plays an import role in identifying support as well as resistance levels in both trend as well as counter-trend trading. Plenty of professional traders use Fibonacci Retracement Levels not only to identify support and resistance levels, but also to be alert that a change in trend may occur. You should always use it in combination with other technical indicators and price action in order to get a more accurate signal.
How can I chart the Fibonacci Retracement Levels?
This is very simple as MetaTrader 4 does all the calculations for you and all you need to do is place it in your chart.

Here is how it is done:
- Open your PaxForex MetaTrader 4 Terminal
- Click on Insert
- Select Fibonacci
- Select Fibonacci Retracement
Start from the left side in your chart and click on the highest or lowest point on the left and draw it to the highest or lowest point on the right of your chart, MetaTrader 4 takes care of the rest. Now you have the Fibonacci Retracement Levels in your chart and can have a much better picture about support and resistance levels.
The four most common retracement levels for a trend are:
- 23.6%
- 38.2%
- 50.0%
- 61.8%
Never just rely on the Fibonacci Retracement Levels, but use them as an indicator which alerts you to conduct a deeper technical analysis and in combination with other indicators as well as price action as any support or resistance level can be breached and turned into the opposite. There are also false breakouts and breakdown which should be kept in mind which is why it is important to never act on one indicator alone.


