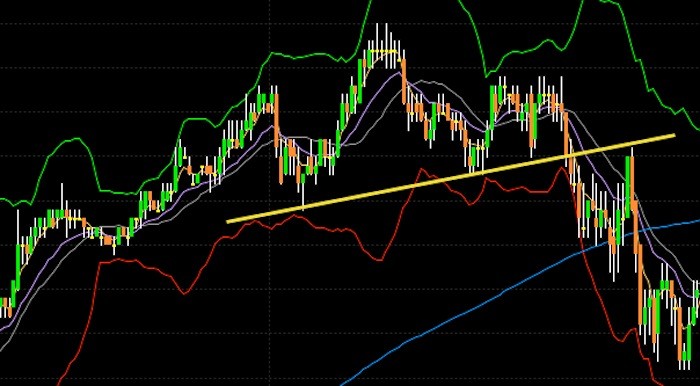
 There are hundreds of thousands of market participants buying and selling securities for a wide variety of reasons: hope of gain, fear of loss, tax consequences, short-covering, hedging, stop-loss triggers, price target triggers, fundamental analysis, technical analysis, broker recommendations and a few dozen more. Trying to figure out why participants are buying and selling can be a daunting process.
Chart patterns put all buying and selling into perspective by consolidating the forces of supply and demand into a concise picture. More importantly, chart patterns and technical analysis can help determine who is winning the battle, allowing traders and investors to position themselves accordingly. Chart pattern analysis can be used to make short-term or long-term forecasts. The data can be intraday, daily, weekly or monthly and the patterns can be as short as one day or as long as many years.
Chart patterns are one of the technical analysis methods, intended to define market turns and trends. Due to those graphical formations it becomes possible to see whether the price is likely to continue its current direction or reverse. Depending on what information traders search for and what skills they master, they can use certain types of charts: the bar chart, the line chart, the candlestick chart and the point and figure chart.
Two basic tenets of technical analysis are that prices trend and that history repeats itself. An uptrend indicates that the forces of demand (bulls) are in control and a downtrend that the forces of supply (bears) are in control. However, prices do not trend forever and as the balance of power shifts, a chart pattern begins to emerge. Certain patterns, such as a parallel channel, denote a strong trend.
The vast majority of chart patterns fall into two main groups: reversal and continuation. Reversal patterns indicate a change of trend and can be broken down into top and bottom formations. Continuation patterns indicate a pause in trend and indicate that the previous direction will resume after a period of time. Many patterns can be classified as either reversal or continuation. Much depends on the previous price action, volume and other indicators as the pattern evolves. This is where the science of technical analysis becomes the art of technical analysis.


